What are the interfaces in PAfE and how does it relate to Perspectives?
Planning Analytics for Excel (PAfE) supports the same core reporting concepts as Perspectives, but with updated interfaces and added flexibility. The functionality is preserved, but the experience is modernised.
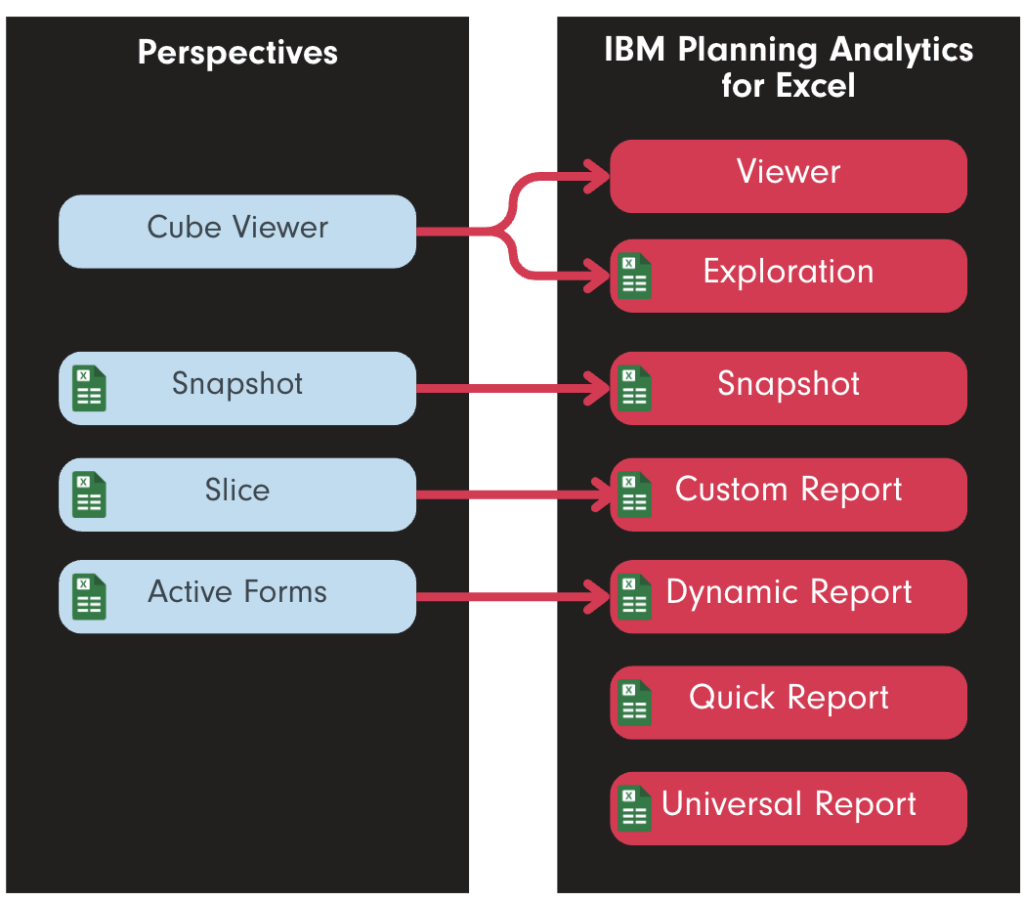
For example, the classic Cube Viewer from Perspectives is now represented in PAfE by two interfaces:
The Viewer is a standalone, browser-like interface outside of Excel
Exploration is an interactive, Excel-embedded interface where you can pivot, filter, and drill into data dynamically
Both can be used to analyse cube data, offering interactive ways to filter, drill, and pivot information.
If you’ve worked with reports in Perspectives, here’s how they translate into PAfE.
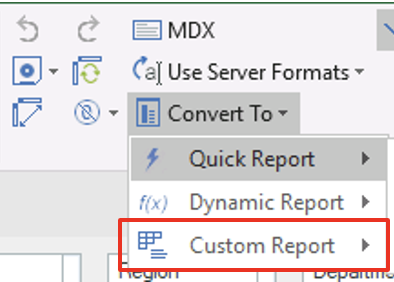
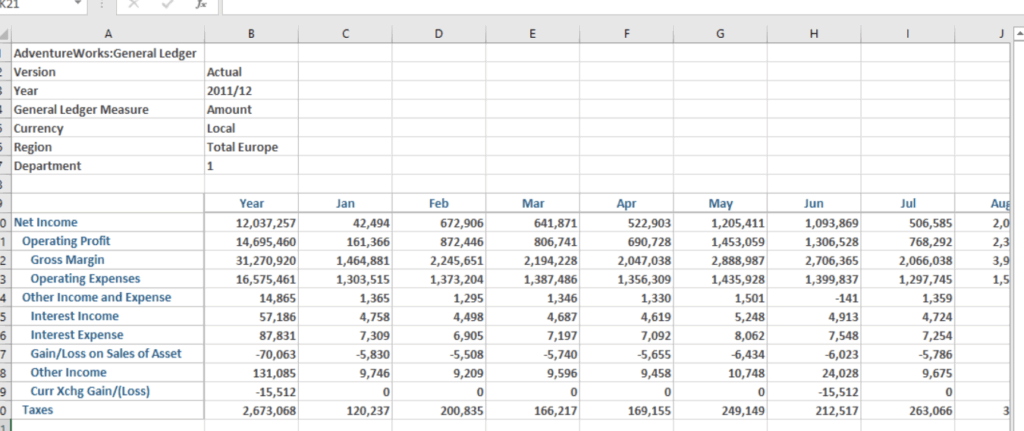
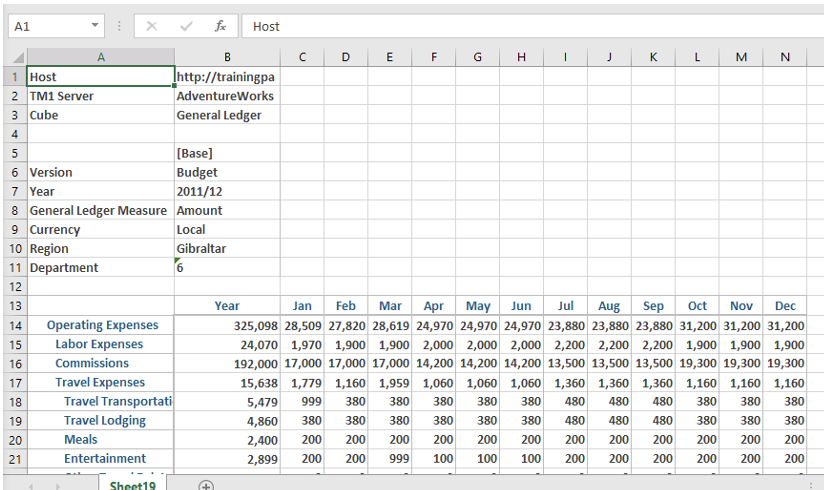
Custom Report (also known as a Sliced Report) preserves the same structure and cell references.
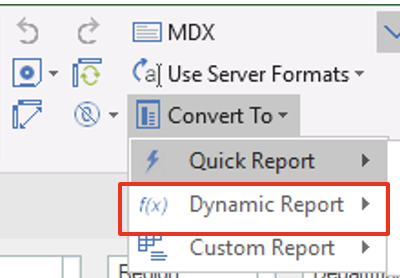
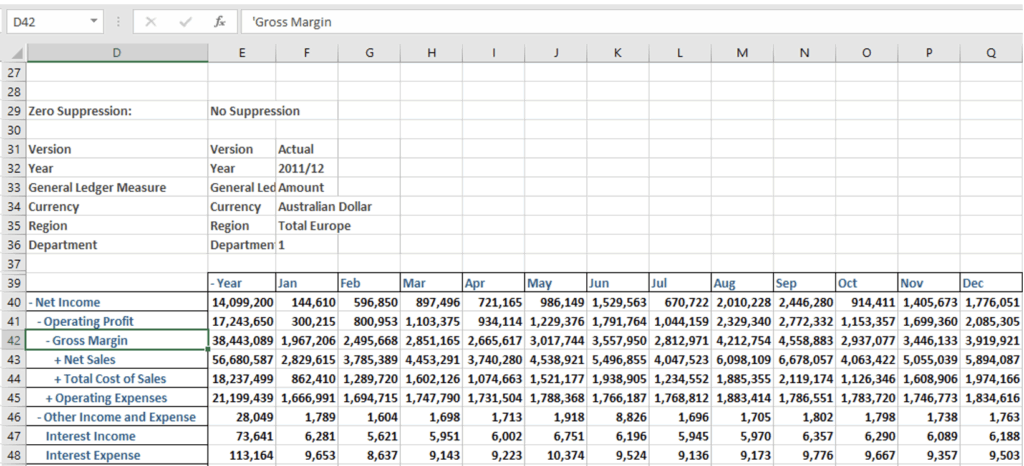
Dynamic Report (also known as an Active Forms) is known for its expand/collapse functionality and dynamic row sets, which are fully supported in PAfE.
Snapshot (no name change) is a static version of the view.
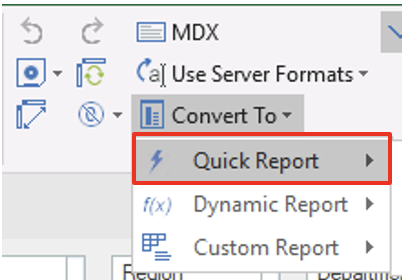
Quick Reports, exclusive to PAfE, lets you rapidly build reports across one or more cubes, with Excel-native formatting and formula support. It’s ideal for users who want fast, flexible reporting with minimal setup.
Universal Reports are a flexible report type, also only available in PAfE, that allows users to create highly customisable, grid-based reports directly in Excel. They combine the ease of Quick Reports with additional layout and formatting options, making them ideal for financial statements, variance analysis, and formatted dashboards. Unlike Explorations or Dynamic Reports, Universal Reports do not maintain a live connection to the TM1 cube structure—they are designed for guided analysis with predefined layouts and data sets. This report type is ideal when you want to lock down the report structure but still allow filtering or selector interaction.
While the names may have changed, the core concepts remain familiar, and the transition is designed to be as smooth as possible.
Connecting to the TM1 Server via PAfE
Before you can begin building or interacting with reports in Planning Analytics for Excel (PAfE), you need to connect to your TM1 server. This connection enables PAfE to access your data models, cube views, and saved reports—just like Perspectives did.
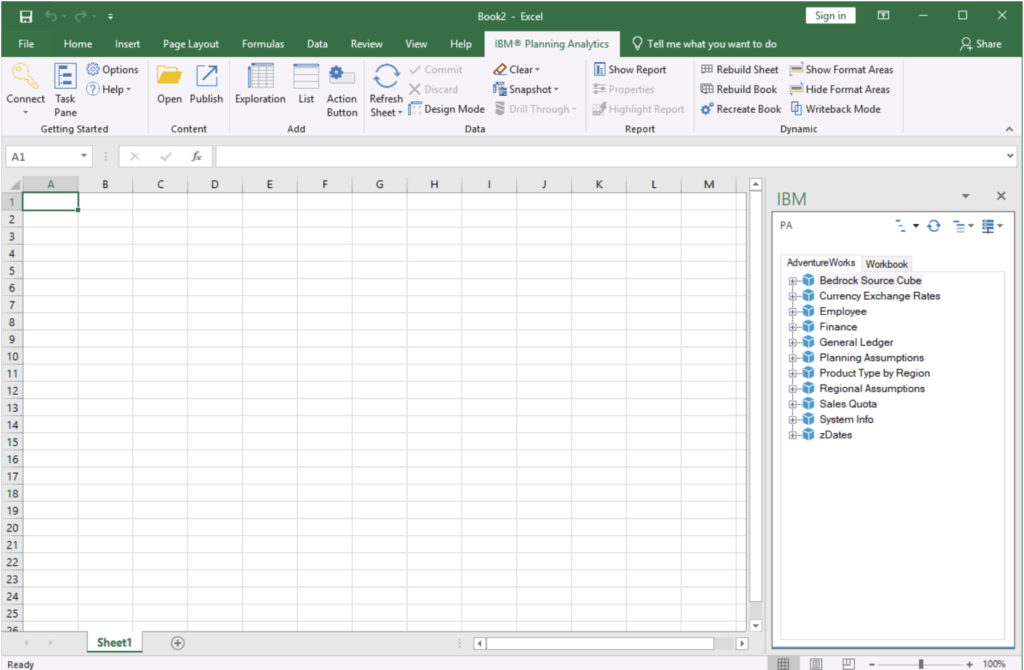
To connect, simply launch Excel and navigate to the IBM Planning Analytics tab on the ribbon.

From there, click Connect, then choose the TM1 Server and select the database you want to access.
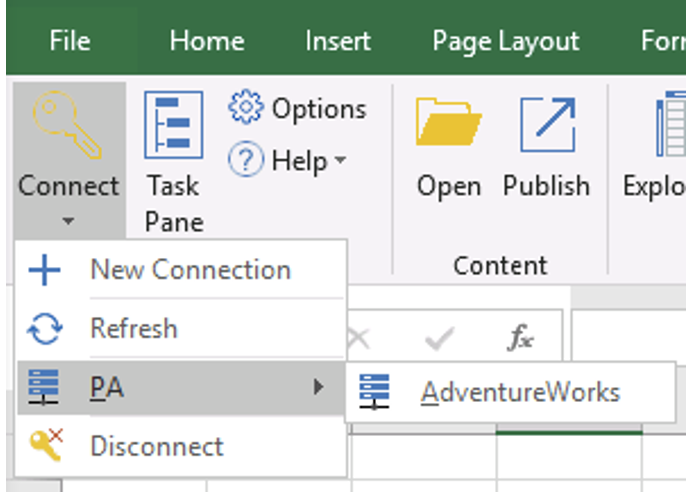
Enter your credentials.
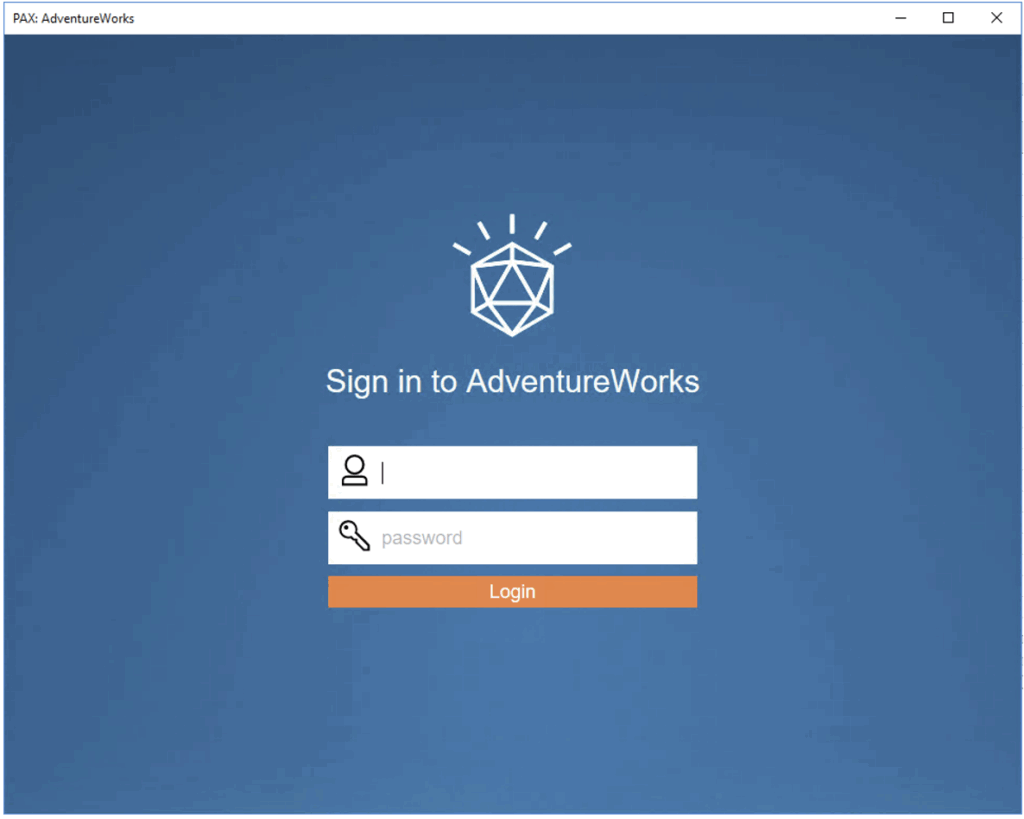
Once authenticated, you’ll be able to browse available TM1 servers and access any Application folders, views, or data sources you have permission to use.
This process mirrors the familiar login flow from Perspectives but offers a cleaner interface and is continuously updated with new features and performance improvements.
How to analyse Cubes
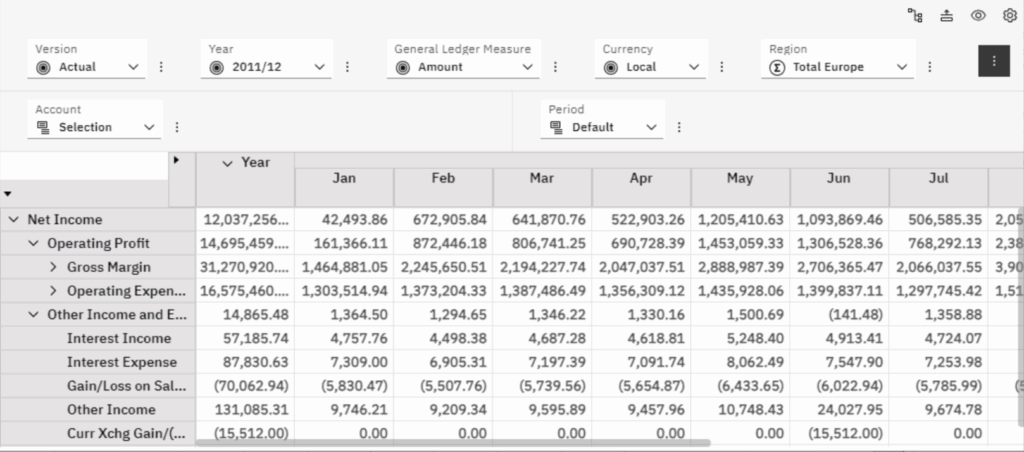
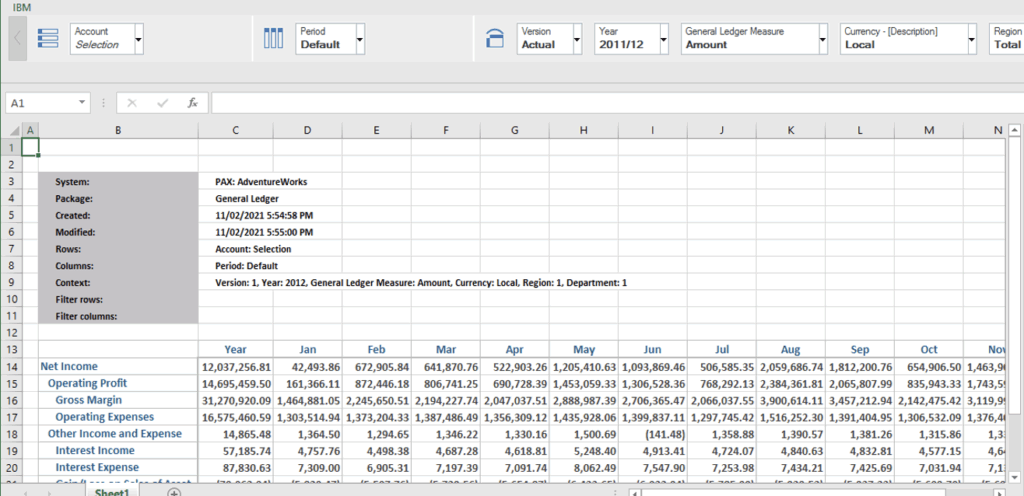
Exploration is one of the fastest and most intuitive ways to analyse a cube in Planning Analytics for Excel (PAfE). It allows users to interact with TM1 data dynamically—filtering, drilling, and pivoting with ease—all within the familiar Excel environment.
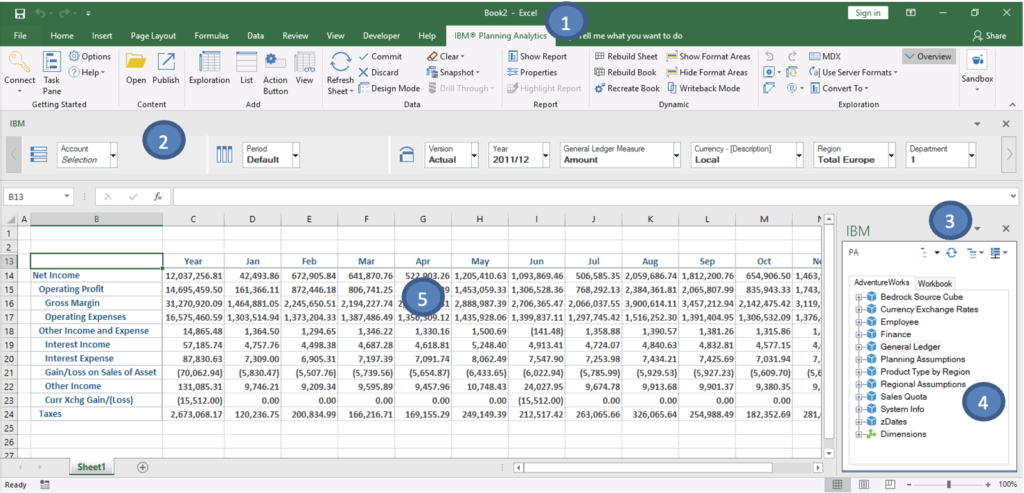
The IBM Planning Analytics tab (1) gives quick access to launch PAfE, connect to TM1 servers, and open saved reports. Once connected, the IBM Task Pane (3) and Source Tree (4) let you browse available cubes and dimensions, making it easy to drag data elements into your workbook.
The Overview Area (2) provides a structured layout where you define rows, columns, and context filters—helping you analyse key intersections of data in real time. Meanwhile, the Work Area (5) (your Excel sheet) becomes an interactive space for building reports and visualising trends.
Whether you’re reviewing high-level summaries or drilling into granular detail, PAfE’s Exploration Views offer a flexible, visual way to uncover insights directly from your TM1 model.
How to find and publish reports created in the Application folder
One of the most seamless parts of transitioning from Perspectives to IBM Planning Analytics for Excel (PAfE) is how familiar the workflow remains—especially when working with reports stored in the TM1 Application folder.
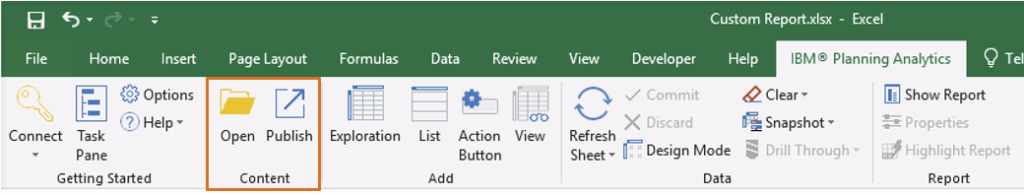
In PAfE, you can still access, open, and publish reports to the same TM1 Server Application Folder that Perspectives users relied on. The process feels almost identical:
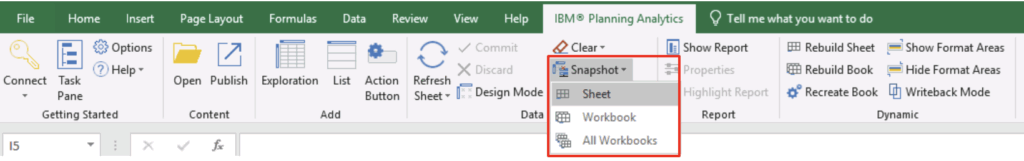
To publish updates, simply use the Publish icon. And to access a report, use the Open icon.
Is the Set Editor in PAfE different from the Subset Editor in Perspectives?
Not really—just the name has changed. In Planning Analytics for Excel (PAfE), what was previously called a Subset in Perspectives is now referred to as a Set.
The purpose remains the same: to help you find and return specific elements to your view, such as departments, accounts, or employees.
The Set Editor provides a familiar layout with a search bar, a source tree of elements, and a Current Set pane that shows your selected items.
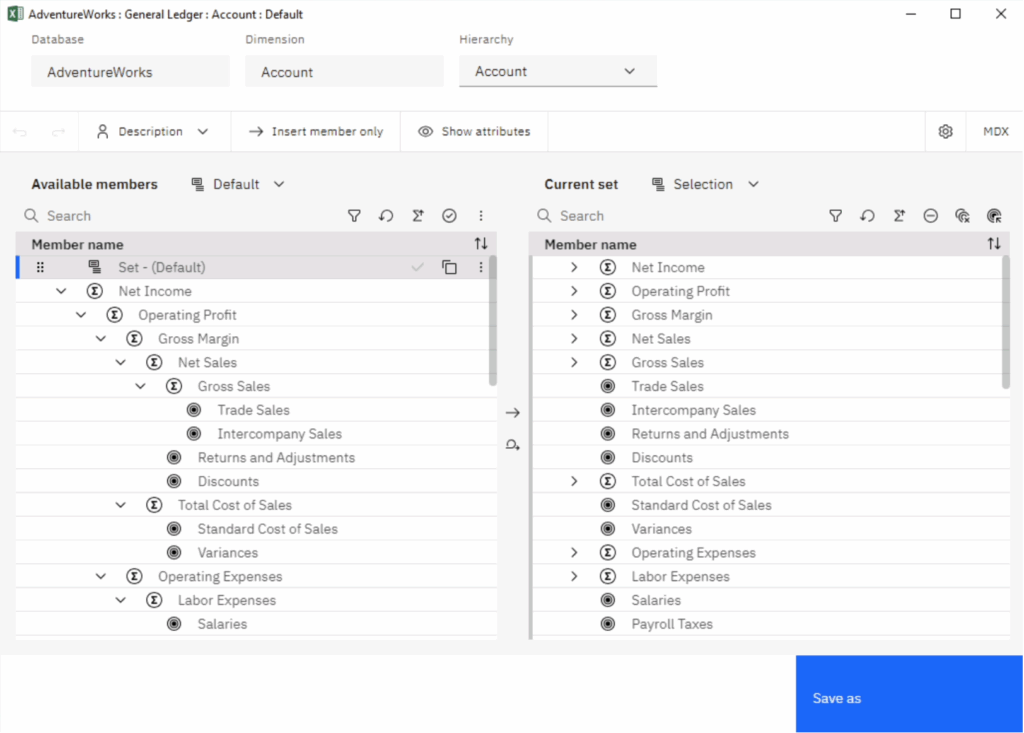
Newer features in the Set Editor:
- Modern UI with Resizable Panes: The editor uses a modern, web-based interface with resizable sections and clearer visual cues, improving usability on high-resolution screens.
- Insert Options for Leaf and Consolidated Elements: In addition to inserting members, PAfE gives you more contextual options such as:
- Insert member with leaf nodes
- Insert descendants
- Insert ancestors
- Insert children
- Drag-and-Drop Support: You can drag elements between panes (e.g. from the hierarchy tree to the Current Set pane), improving interaction efficiency compared to Perspectives’ button-driven UI.
- Multiple Hierarchies Support: PAfE supports selecting from multiple hierarchies within a dimension directly from the Set Editor—something Perspectives does not support. This is essential for modern models using alternate hierarchies.
Why Move to PAfE?
While Perspectives remains a powerful Excel plugin, PAfE is IBM’s actively supported and enhanced interface. Benefits include:
- Regular updates and performance improvements
- Better compatibility with modern Excel versions
- New reporting types like Quick and Universal Reports
- Seamless integration with Planning Analytics Workspace (PAW)
Frequently Asked Questions
Q: Do I need to recreate my reports when switching from Perspectives to PAfE?
A: Not at all. Most existing reports carry over without issue. For example, Sliced reports become Custom Reports, and Active Forms are fully supported as Dynamic Reports in PAfE.
Q: Are Active Forms still available in PAfE?
A: Yes. Active Forms are now called Dynamic Reports in PAfE. They retain all the key functionality—including dynamic row expansion, expand/collapse controls, and interaction with cell-based logic.
Q: What’s the difference between Custom, Dynamic, Quick, and Universal Reports in PAfE?
A:
- Custom Reports = Classic Slices (preserves Excel structure)
- Dynamic Reports = Active Forms (expandable, formula-driven rows)
- Quick Reports = Fast, Excel-native reports with formatting and formulas
- Universal Reports = Highly formatted, grid-based reports that aren’t connected live to the cube structure
Q: Can I still publish and retrieve reports from the Application Folder?
A: Yes. PAfE allows you to publish and open reports from the TM1 Application Folder—just as you did in Perspectives.
Q: What’s new in PAfE compared to Perspectives?
A: PAfE introduces:
- A modern interface that integrates with Excel’s ribbon
- Enhanced Set Editor with drag-and-drop and hierarchy support
- New report types like Quick and Universal Reports
- Ongoing product updates and performance enhancements
Q: Is there a learning curve when switching to PAfE?
A: The core concepts remain the same, so the learning curve is minimal for experienced users. However, to unlock all the new features and best practices, we strongly recommend structured training.
Ready to Get the Most Out of PAfE?
Whether you’re transitioning from Perspectives or starting fresh with Planning Analytics for Excel, our end-user training courses are designed to give you practical skills and confidence.
✅ Learn how to build and customise each report type
✅ Master Dynamic Reports (Active Forms) and Quick Reports
✅ Navigate the new interface with ease
✅ Discover tips, shortcuts, and best practices from industry experts
👉 Start your PAfE journey with expert guidance — Explore our training courses here